
Contents
show
Best Business Intelligence Reporting Tools for Data-Driven Decisions
Business intelligence (BI) reporting tools help companies analyze and visualize data for better decision-making. According to Statista, the global BI software market is projected to reach 40 billion dollars by 2026, highlighting the increasing demand for data-driven insights. This guide explores the best BI reporting tools and their impact on business performance (Statista).
What Are Business Intelligence Reporting Tools?
BI reporting tools collect, process, and present data through interactive dashboards and reports. These tools help organizations track key performance indicators (KPIs), forecast trends, and make data-driven decisions. Research from Forbes shows that companies using BI tools improve decision-making efficiency by 35 percent (Forbes).
Why Businesses Need BI Reporting Tools
BI tools provide actionable insights by transforming raw data into meaningful reports. Key benefits include:
- Enhancing data-driven decision-making with real-time insights
- Automating report generation to reduce manual workload
- Identifying business trends and customer behavior patterns
- Improving operational efficiency through performance tracking
- Providing data visualization for better stakeholder communication
Top Business Intelligence Reporting Tools
These BI tools help businesses analyze and visualize data to drive growth and efficiency.
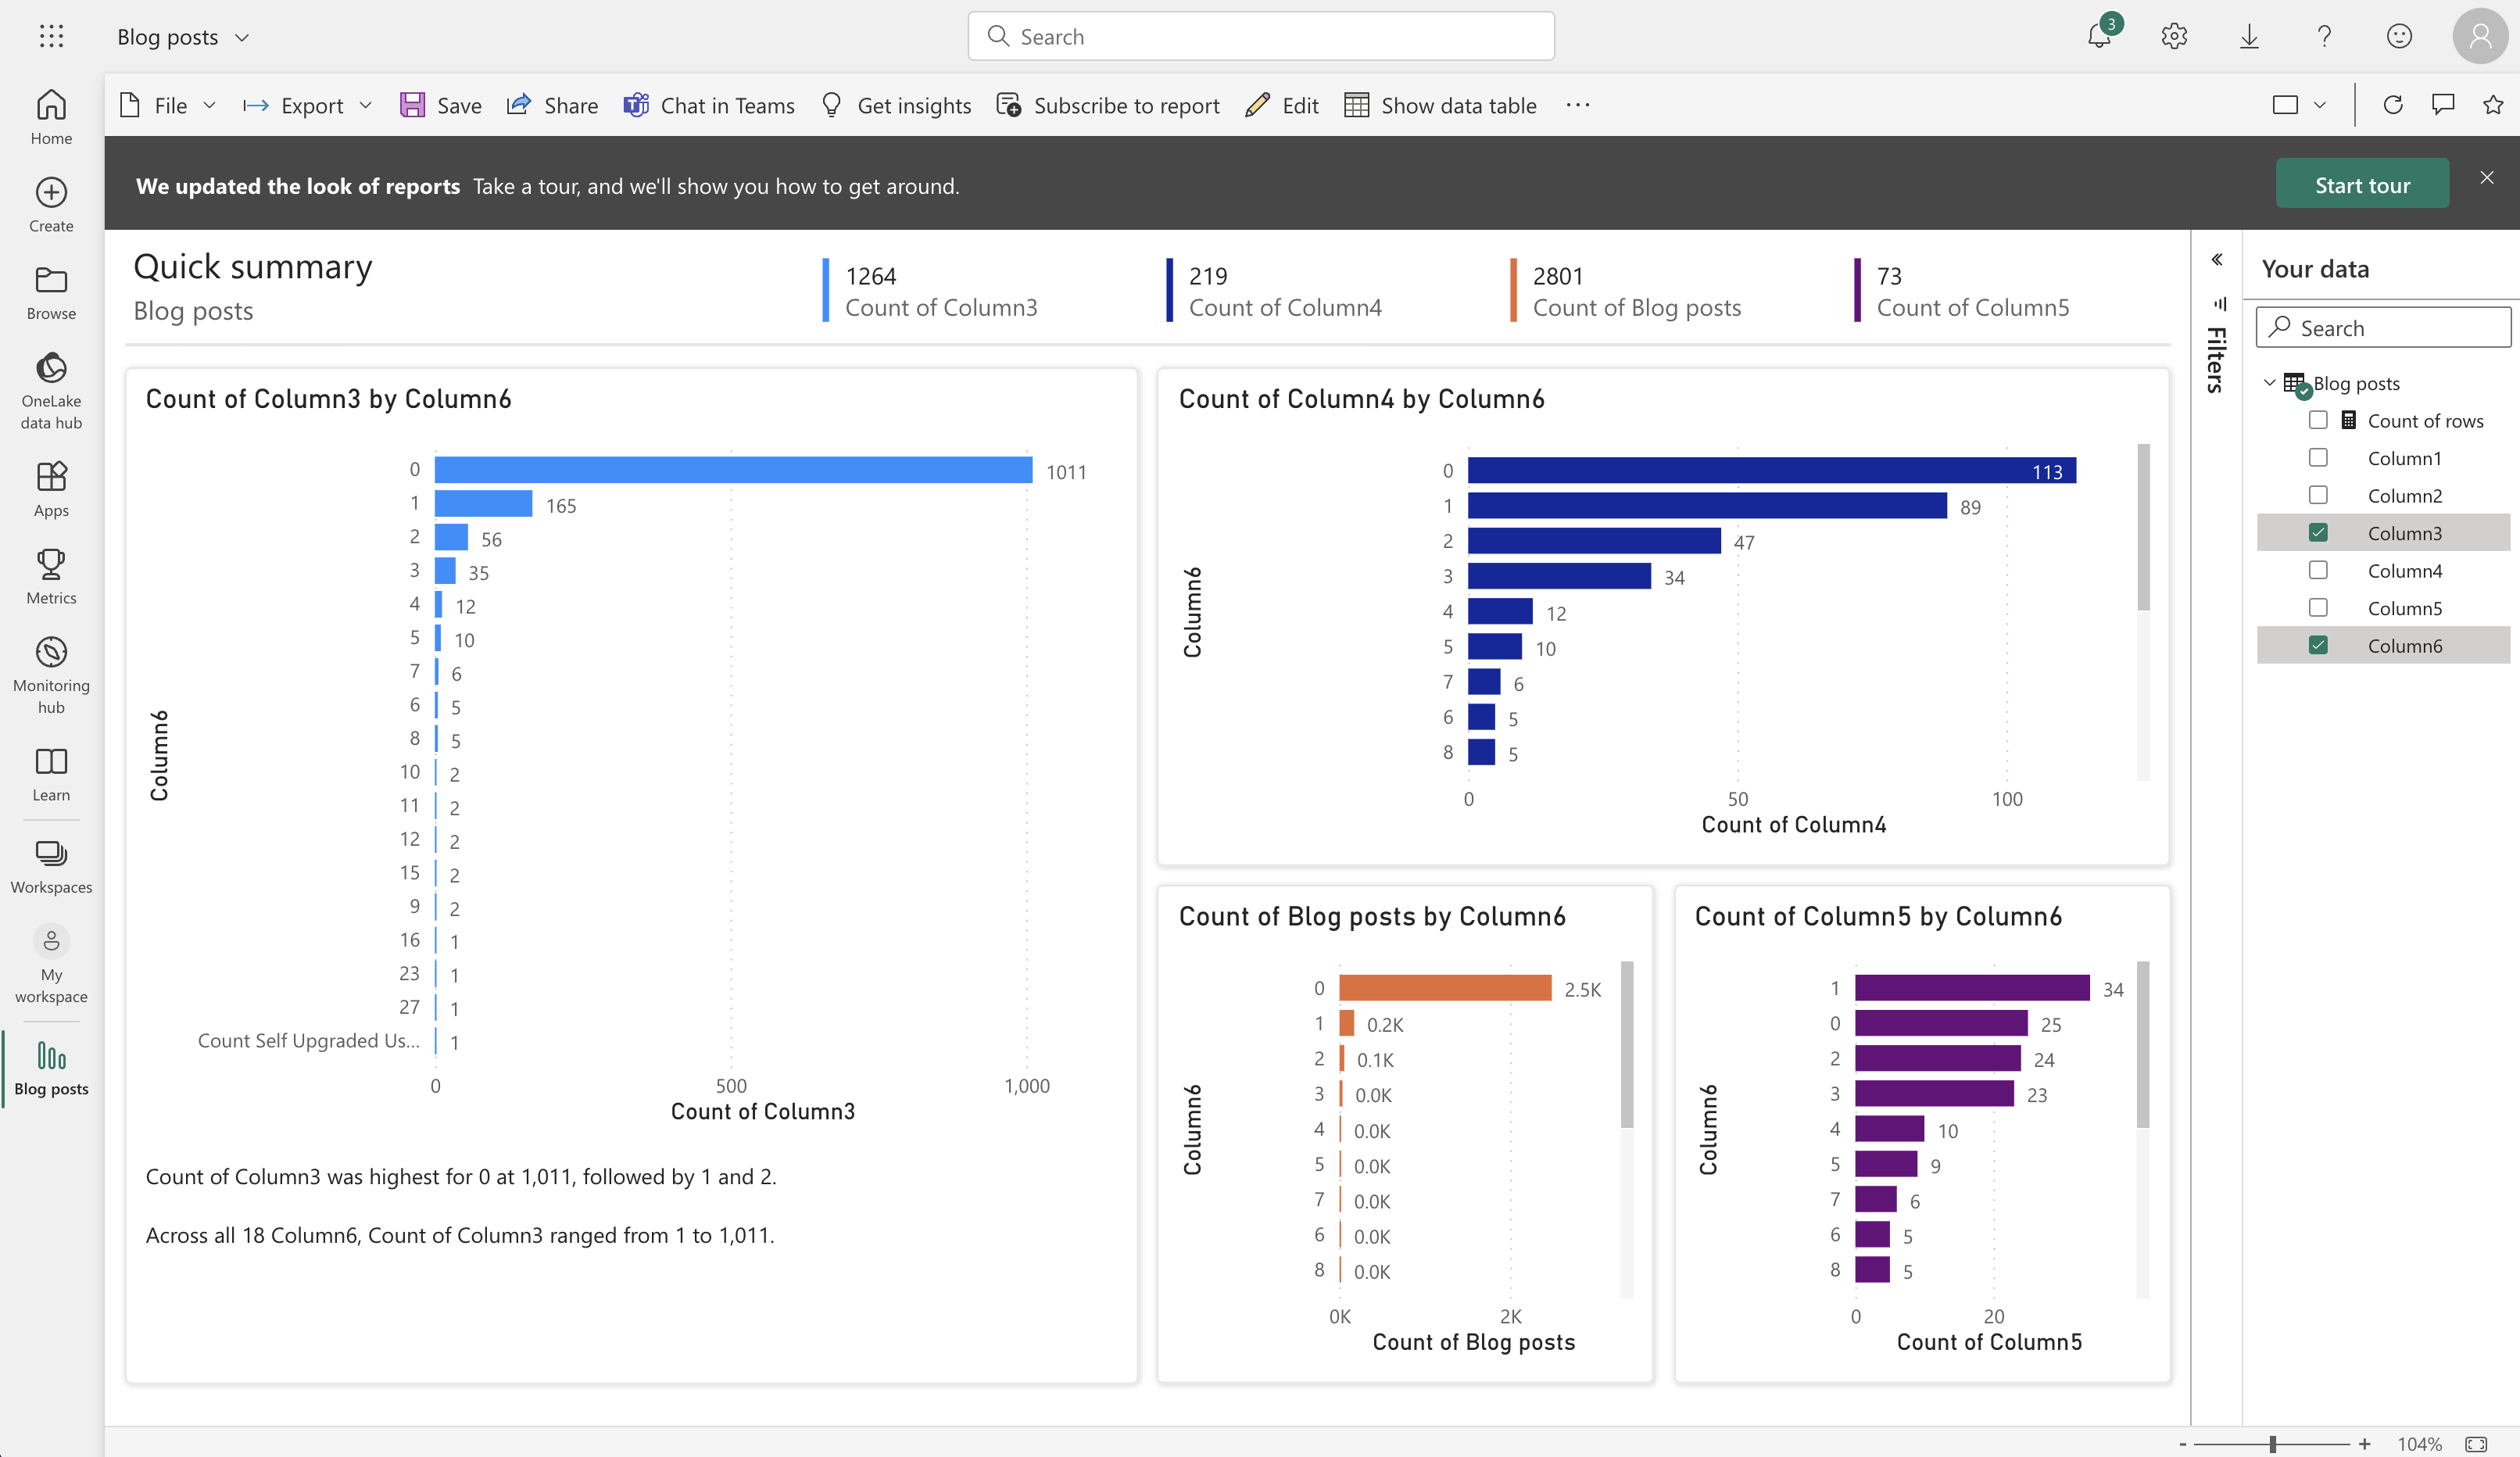
1. Microsoft Power BI
Power BI offers interactive dashboards, AI-powered analytics, and seamless integration with Microsoft tools. Companies using Power BI experience a 40 percent increase in data accessibility (Microsoft).
2. Tableau
Tableau provides advanced data visualization, predictive analytics, and AI-driven insights.
3. Google Data Studio
Google Data Studio enables businesses to create real-time, customizable reports using Google Analytics and other data sources.
4. Qlik Sense
Qlik Sense leverages AI-driven analytics to uncover business trends and optimize operations.
5. Looker
Looker provides modern BI solutions with data exploration and modeling features.
6. Domo
Domo offers cloud-based business intelligence and automated reporting.
How BI Reporting Tools Improve Business Performance
BI tools enhance decision-making by providing actionable insights and real-time data visualization.
Challenges of Using BI Reporting Tools
Despite their advantages, BI reporting tools come with challenges that businesses should address.
- High implementation costs for enterprise-level BI platforms
- Data security risks associated with cloud-based reporting
- Complexity in integrating multiple data sources
- Requires proper training for employees to interpret BI reports
Best Practices for Using BI Reporting Tools
To maximize the effectiveness of BI tools, businesses should follow these best practices.
- Define key performance indicators to track relevant business metrics
- Use AI-driven analytics for predictive insights and trend forecasting
- Ensure data security compliance when handling sensitive business information
- Regularly update dashboards to reflect real-time data changes
How to Choose the Right BI Reporting Tool
Businesses should consider the following factors when selecting a BI reporting tool:
- Integration with existing data sources and CRM platforms
- Scalability to handle growing data needs
- User-friendly interface with customizable dashboards
- AI-driven analytics for predictive modeling and automation
Why Choose TaskVirtual for BI Reporting Services?

TaskVirtual provides expert BI reporting services to help businesses optimize data analysis and visualization.
- Custom BI dashboard creation for real-time business insights
- Integration with Power BI, Tableau, and Google Data Studio
- Expert consultation on data-driven decision-making
- Expert consultation on AI-powered browsing efficiency
- Affordable pricing starting at $3.12 / hour to $14.99 / hour, ensuring value for money.
- 364 positive reviews on esteemed VA reviewing platforms, which amounted to a 4.7-star rating
- Customized data visualization solutions for enterprises
Conclusion
Business intelligence reporting tools help companies make data-driven decisions, optimize performance, and improve forecasting. With platforms like Power BI, Tableau, and Google Data Studio, businesses can leverage real-time analytics to stay competitive in a digital economy. As data-driven decision-making becomes essential, integrating BI tools will be crucial for future business growth.
![]() Siddhartha Basu is a Technical Writer at Task Virtual. He loves online games, e-book reading, and Yoga.
Siddhartha Basu is a Technical Writer at Task Virtual. He loves online games, e-book reading, and Yoga.